Note
Go to the end to download the full example code
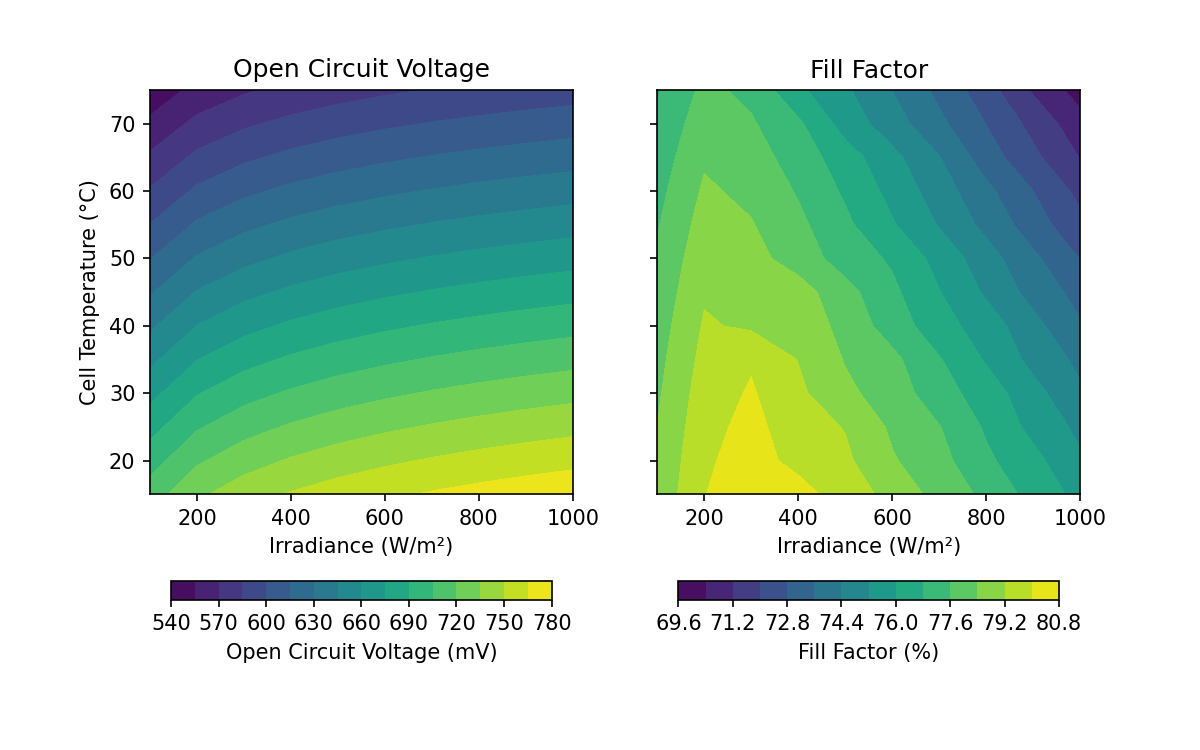
Effect of temperature and intensity on solar cell#
Showing the effect of cell temperature and light intensity on Voc and FF
This examples shows how to visulize the effects of the cell temperature and light intensity (irradiance) on the open circuit voltage (VoC) and fill factor (FF) of a single junction solar cell. This is done by defining a One-Diode model of a silicon solar cell and calculating the Voc and FF for a grid of irradiance levels and cell temperatures
import pandas as pd
import numpy as np
import matplotlib.pyplot as plt
import seaborn as sns
from pv_tandem import electrical_models
After loading the nessesary python libraries, the diode model is defined with the temperature coefficents for Voc and Jsc, series and shunt resistance, ideality factor and dark saturation current.
one_diode = electrical_models.OneDiodeModel(
    tcJsc=0.00032, tcVoc=-0.0041, R_shunt=2000, R_series=2, n=1, j0=1e-11
)
Then, data data grid of cell temperature (defined in °C) and irradiance (W/m2) is created as a pandas DataFrame.
df = pd.DataFrame(
    {
        "temperature": np.repeat(np.arange(15, 76, 5), 10),
        "irrad": np.tile(np.arange(100, 1100, 100), 13),
    }
)
The irradiance is transformed transformed into a short ciurcuit density (mA/cm2) assuming a generation of 40.6 mA/cm2 for a illumination of 1000 W/cm2.
df["j_ph"] = df["irrad"] / 1000 * 40.6
Short circuit current and temperature are fed into the diode model for the resulting IV parameters and Voc and FF are plotted as functions of irradiance and temperature.
params = one_diode.calc_iv_params(df["j_ph"], df["temperature"])

df = pd.concat([df, params], axis=1)
df = df.set_index(["temperature", "irrad"])

v_oc = df["Voc"].unstack("irrad")
ff = df["FF"].unstack("irrad")

fig, (ax1, ax2) = plt.subplots(1, 2, sharey=True, figsize=(8, 5), dpi=150)

ax1.set_title("Open Circuit Voltage")
ax2.set_title("Fill Factor")

cs1 = ax1.contourf(v_oc.columns, v_oc.index, v_oc.values * 1e3, levels=15)
cs2 = ax2.contourf(ff.columns, ff.index, ff.values * 1e2, levels=15)
ax1.set_ylabel("Cell Temperature (°C)")
ax1.set_xlabel("Irradiance (W/m²)")
ax2.set_xlabel("Irradiance (W/m²)")

fig.colorbar(
    cs1,
    ax=ax1,
    shrink=0.9,
    orientation="horizontal",
    label="Open Circuit Voltage (mV)",
)
fig.colorbar(
    cs2, ax=ax2, shrink=0.9, orientation="horizontal", label="Fill Factor (%)"
)
<matplotlib.colorbar.Colorbar object at 0x7f31993fc700>
Total running time of the script: ( 0 minutes 0.619 seconds)