Note
Go to the end to download the full example code
Modeling Photocurrent Density for Tandem Solar Cells#
Using spectral on-demand data from NREL and simulated EQE data from GENPRO4.
# sphinx_gallery_thumbnail_number = 3
This example shows how to calculate the photocurrent density in the subcells of a tandem solar cell. It uses “spectral-on-demand” data from the NSRDB providded by NREL. For the absorptances of the subcells GENPRO4 simulated EQE curves are used originally createf for the following publication: Reference ———- .. [1] P. Tillmann, K. Jäger, A. Karsenti, L. Kreinin, C. Becker (2022)
“Model-Chain Validation for Estimating the Energy Yield of Bifacial Perovskite/Silicon Tandem Solar Cells,” Solar RRL 2200079, DOI: 10.1002/solr.202200079
import pandas as pd
import numpy as np
import matplotlib.pyplot as plt
from pv_tandem import utils

plt.rcParams["figure.dpi"] = 140
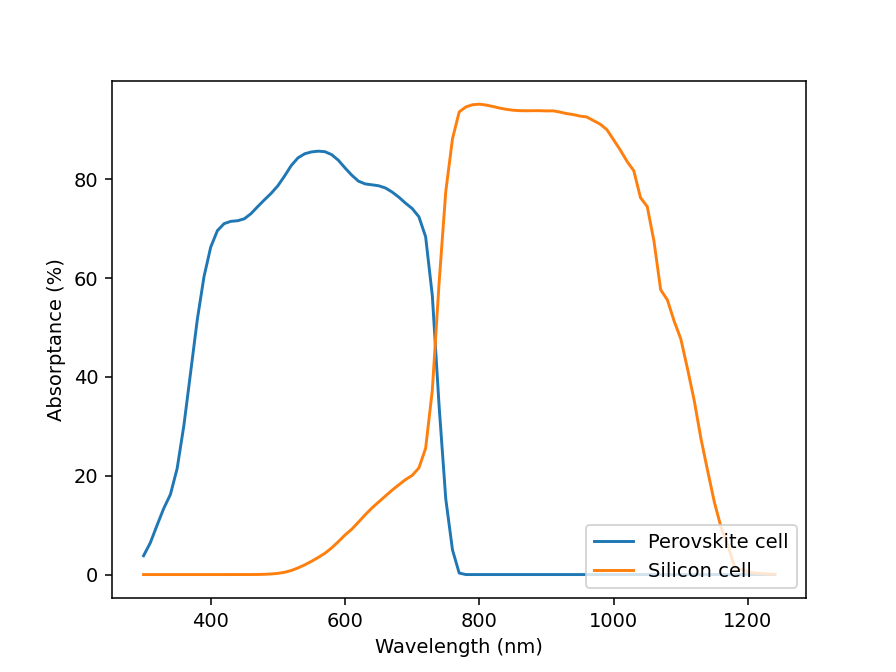
First, the simulated EQE data for the perovskite on silicon 2 terminal tandem is loaded from the corresponding csv-file. In order to work with pv_tandem the EQE data needs to be stored as a pandas DataFrame with the column names specific to the subcell names and the wavelengthsin nm as index. The EQE data has to be between 0 and 1.
example_eqe = pd.read_csv("./data/eqe_tandem_2t.csv", index_col=0)
ax = (example_eqe * 100).plot()
ax.set_xlabel("Wavelength (nm)")
ax.set_ylabel("Absorptance (%)")
ax.legend(["Perovskite cell", "Silicon cell"], loc="lower right")
plt.show()
Next, the spectral data is loaded. The spectral data has to be stored as a pandas DataFrame, with the column names corresponding to the wavelengths in nm and should have the unit W/m²/nm
spec_irrad_ts = pd.read_csv(
    "./data/spec_poa_dallas_2020.csv", index_col=0, parse_dates=True
)
spec_irrad_ts.columns = spec_irrad_ts.columns.astype(float)
# converting to W/m²/nm from W/m²/µm and clipping negative values to zero
spec_irrad_ts = spec_irrad_ts.clip(lower=0) / 1000
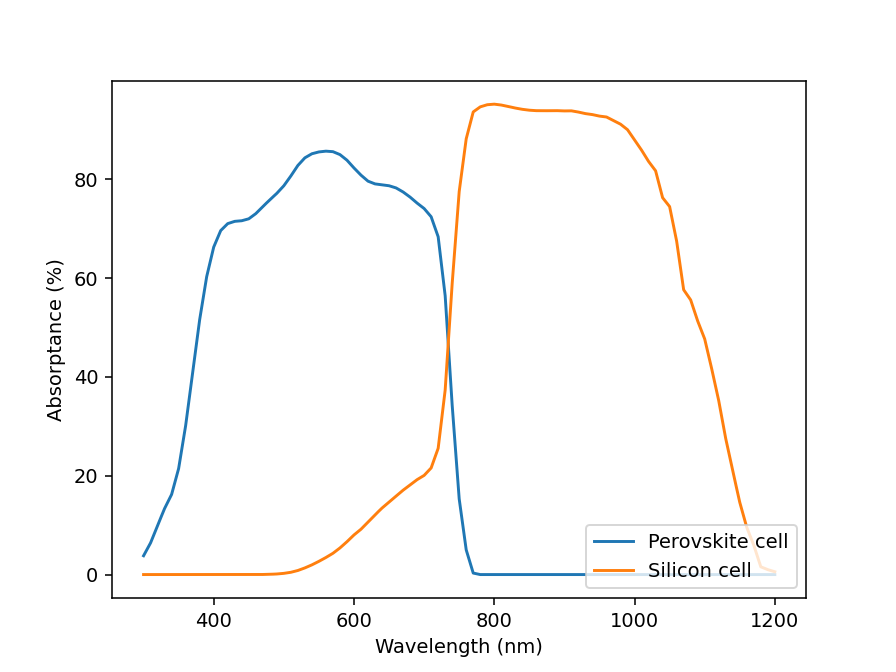
In order to calculate the photocurrent from the EQE and spectral irradiance both need to be specified for the same wavelengths. pv_tandem provides a convinice function to transform either the spectral data at the same wavelength grid as the EQE or vice versa.
eqe = utils.interp_eqe_to_spec(example_eqe, spec_irrad_ts)
ax = (eqe * 100).plot()
ax.set_xlabel("Wavelength (nm)")
ax.set_ylabel("Absorptance (%)")
ax.legend(["Perovskite cell", "Silicon cell"], loc="lower right")
plt.show()
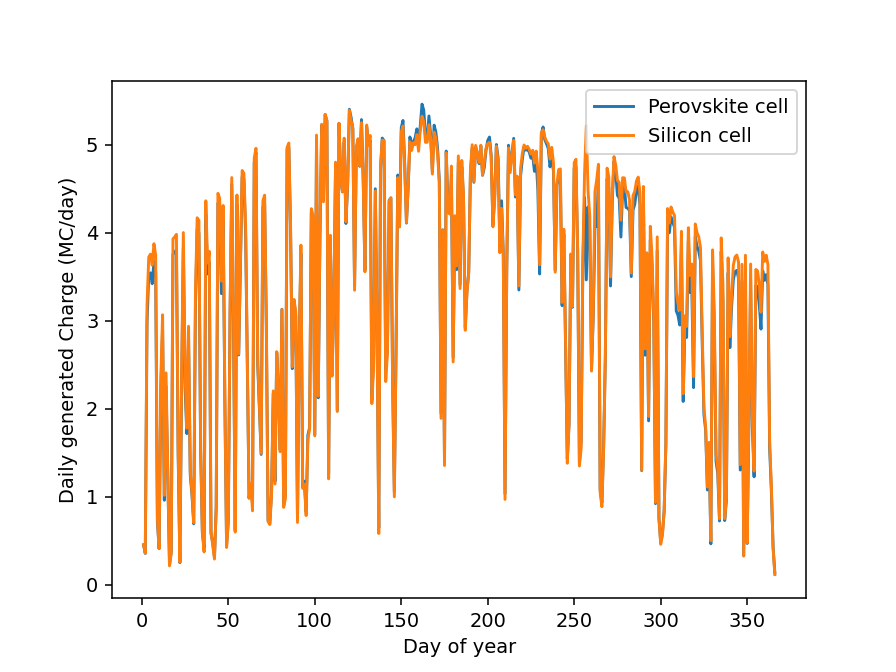
Finally the photocurrent density is calculated. This has to be done seperatly for each subcell. In this example we aggrgate the generated charge density (time integrated curent) for each day of the year for the purpose of visulizing the small differences between the perovskite and silicon subcell.
j_ph = pd.concat(
    [
        utils.calc_current(spec_irrad_ts, eqe["pero"]),
        utils.calc_current(spec_irrad_ts, eqe["si"]),
    ],
    axis=1,
)

ax = (j_ph.groupby(j_ph.index.dayofyear).sum() * 3.6 / 1000).plot()
ax.set_xlabel("Day of year")
ax.set_ylabel("Daily generated Charge (MC/day)")
ax.legend(["Perovskite cell", "Silicon cell"], loc="upper right")
plt.show()
Total running time of the script: ( 0 minutes 0.788 seconds)