Note
Go to the end to download the full example code
Bifacial Irradiance Yield#
Demonstrating the irradiance calculation on the front and backside over one year.
# sphinx_gallery_thumbnail_number = 2
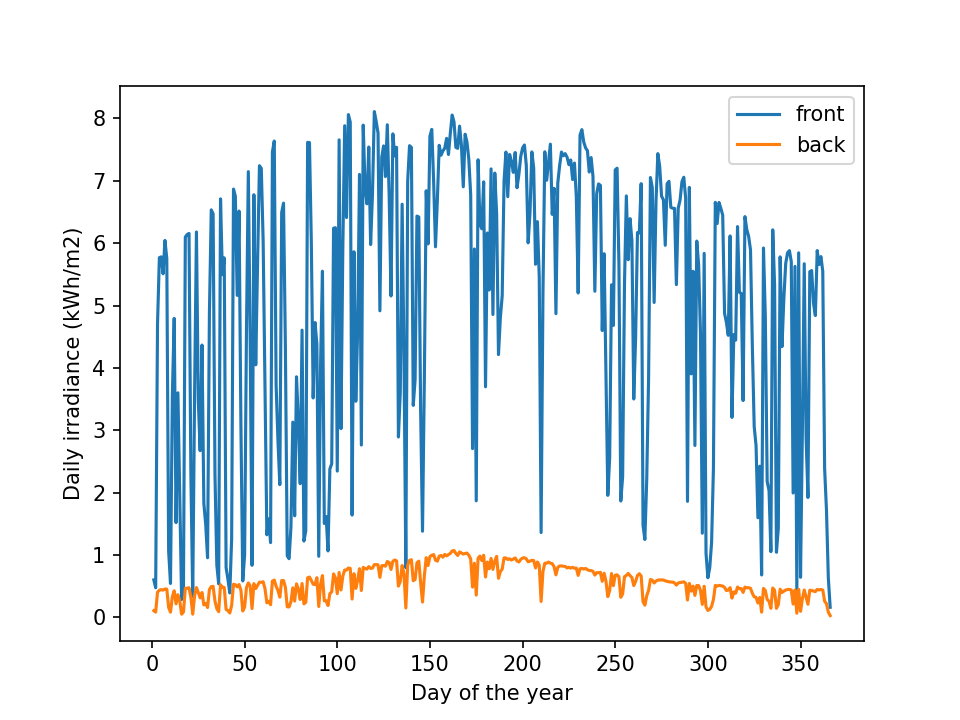
This example shows how to model the irradiance on the front and backside if a bifacial solar cell. It uses the irradiance data for the direct and diffuse components from Dallas for the year 2020.
First the relevant libraries are loaded and the solar potion is calculated with the python library pvlib
from pv_tandem.bifacial import IrradianceSimulator
import matplotlib.pyplot as plt
import numpy as np
import pvlib
import pandas as pd
import seaborn as sns
meta_ts = pd.read_csv(
"../data/meta_ts_dallas_2020.csv", index_col=0, parse_dates=True
)
coord_dallas = dict(latitude = 32.8, longitude = -96.8)
solar_pos = pvlib.solarposition.get_solarposition(meta_ts.index, **coord_dallas)
illumination_df = meta_ts
illumination_df['zenith'] = solar_pos['zenith']
illumination_df['azimuth'] = solar_pos['azimuth']
illumination_df = illumination_df[['DNI','DHI','zenith','azimuth']]
simulator = IrradianceSimulator(illumination_df,
albedo=0.3,
module_length=1.96,
mount_height=0.5,
module_spacing=6,
module_tilt=25
)
irrad_poa = simulator.simulate(simple_results=True)
fig, ax = plt.subplots(dpi=150)
(irrad_poa.groupby(irrad_poa.index.dayofyear).sum()/1000).plot(ax=ax)
ax.set_xlabel('Day of the year')
ax.set_ylabel('Daily irradiance (kWh/m2)')
plt.show()
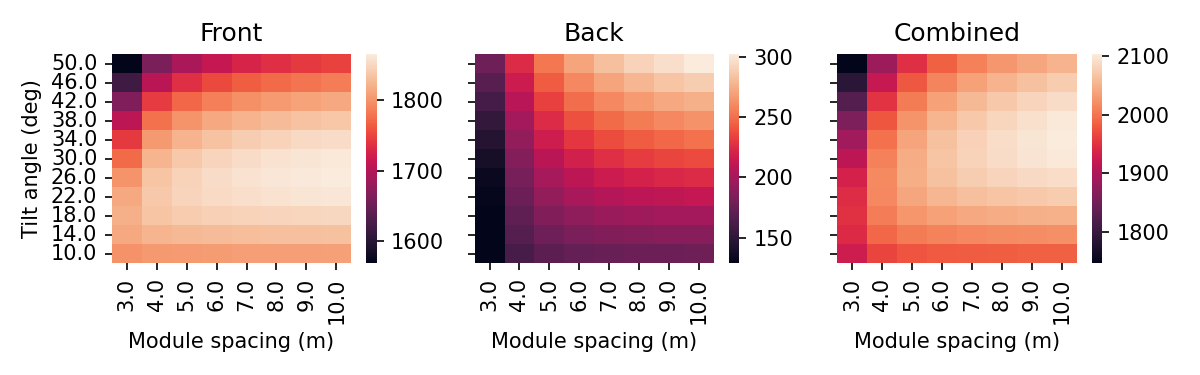
tilt_angles = np.arange(10,54,4)
spacings = np.arange(3,11,1)
scan_res = []
for tilt_angle in tilt_angles:
for spacing in spacings:
simulator = IrradianceSimulator(
illumination_df,
albedo=0.3,
module_length=1.96,
mount_height=0.5,
module_spacing=spacing,
module_tilt=tilt_angle
)
res_tmp = simulator.simulate(simple_results=True)
# sum over the year and convert from Wh to kWh
res_tmp = res_tmp.sum()/1000
res_tmp['total'] = res_tmp.sum()
res_tmp['tilt'] = tilt_angle
res_tmp['spacing'] = spacing
scan_res.append(res_tmp)
scan_res = pd.concat(scan_res, axis=1).T
scan_res = scan_res.set_index(['tilt', 'spacing'], drop=True)
fig, (ax1, ax2, ax3) = plt.subplots(1, 3, dpi=150, figsize=(8,2.5), sharey=True)
sns.heatmap(scan_res['front'].unstack('spacing').sort_index(ascending=False), ax=ax1, cbar_ax=None)
sns.heatmap(scan_res['back'].unstack('spacing').sort_index(ascending=False), ax=ax2, cbar_ax=None)
sns.heatmap(scan_res['total'].unstack('spacing').sort_index(ascending=False), ax=ax3)
ax1.set_title("Front")
ax2.set_title("Back")
ax3.set_title("Combined")
ax1.set_xlabel('Module spacing (m)')
ax2.set_xlabel('Module spacing (m)')
ax3.set_xlabel('Module spacing (m)')
ax1.set_ylabel('Tilt angle (deg)')
ax2.set_ylabel("",visible=False)
ax3.set_ylabel("",visible=False)
fig.tight_layout()
Total running time of the script: (0 minutes 12.828 seconds)